Wind Energy Estimation using Statistics and Data Science
Wind energy is a vital renewable resource that plays a key role in reducing reliance on
fossil fuels and mitigating climate change. As one of the fastest-growing energy sources, it provides a
clean, sustainable, and cost-effective alternative for electricity generation. Advances in turbine technology,
offshore wind farms, and grid integration have significantly improved efficiency and scalability.
Project Objectives and Expectations
- ▶ Classify given location based on wind power.
- ▶ Identify the optimal wind direction for installing a wind generator.
- ▶ Determine calmest and most windy months.
- ▶ Estimate amount of wind energy based on a given scenario and available technology.
Project Set-up
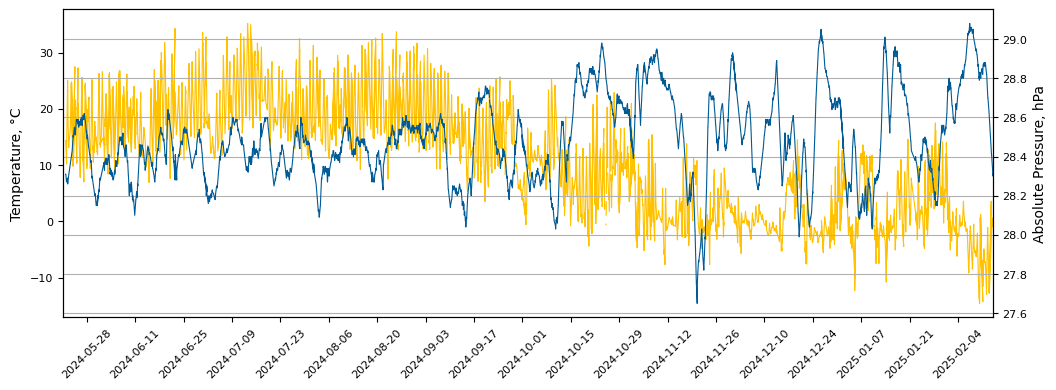
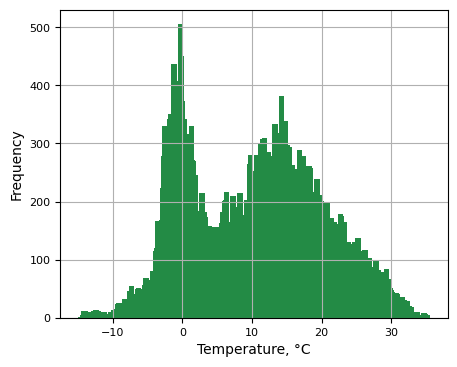
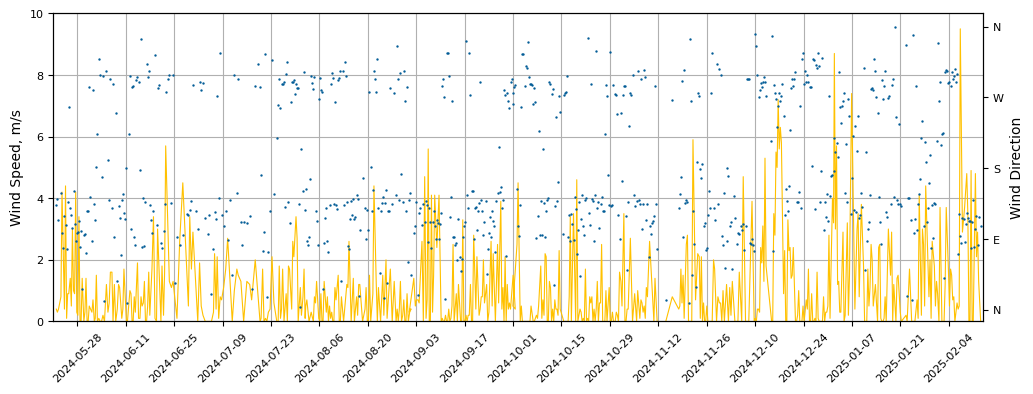
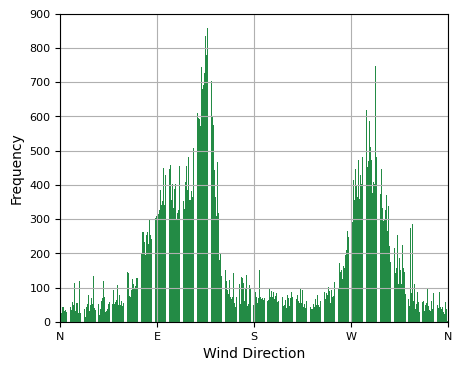
For this research we will use the measurements enquired by the Weather Station WS2910,
which registers the following parameters:
- ✔ Temperature
- ✔ Humidity
- ✔ Solor
- ✔ Wind Speed
- ✔ Wind Gust
- ✔ Wind Direction
- ✔ Rain Rate
- ✔ Pressure
Wind Energy Estimation
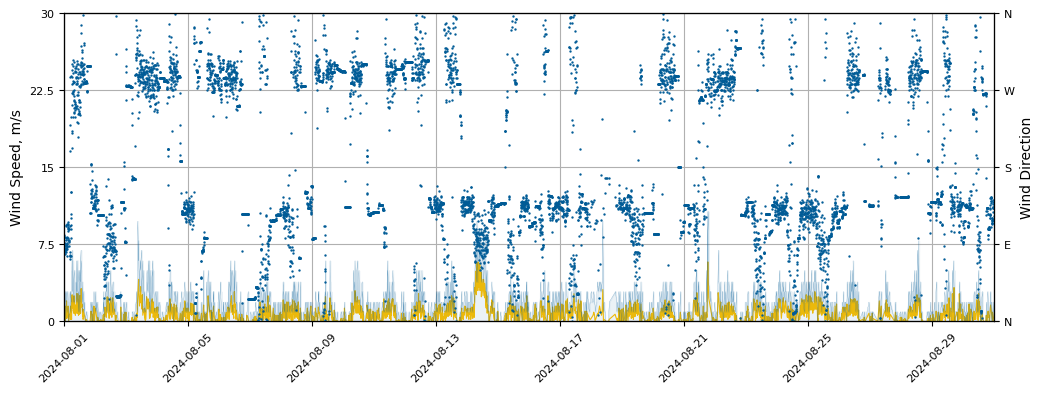
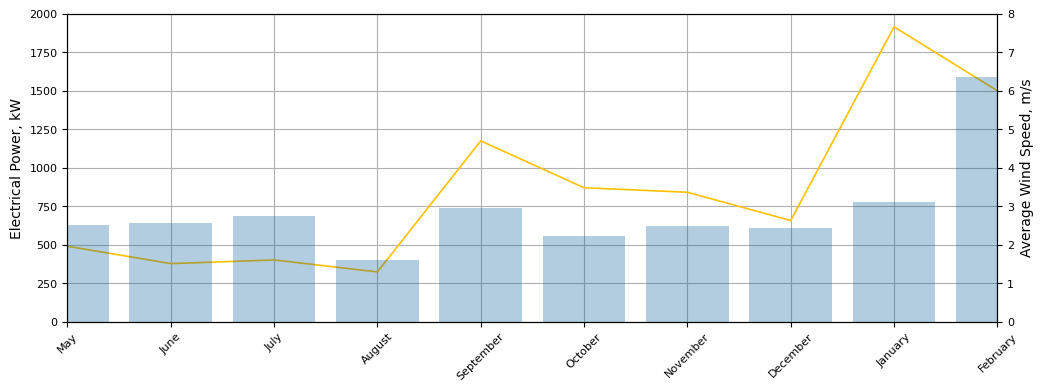
Data indicates that January is a month with the highest wind activity, while August is the lowest.
This pattern is also reflected across seasons, with winter being the windiest time of the year. This aligns perfectly with electricity
consumption trends, as energy usage significantly increases during colder months.
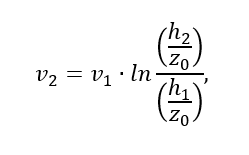
Below graphs show the wind speed and direction trneds.
Wind Speed & Direction - January
Wind Direction Distribution - January
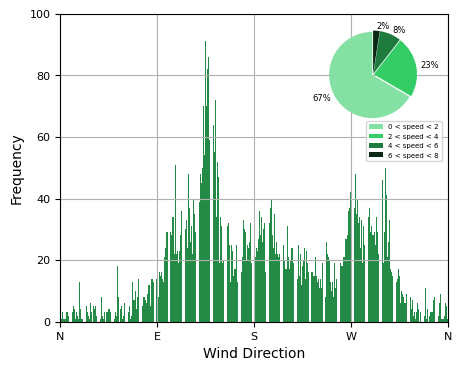
- ●The wind speed data indicates that January is a
relatively stable month with a generally good average wind speed, even though 67% of wind speeds are below 2 m/s.
- ●Wind direction although follows general yearly trend - is more shifted towards the 125° in January.
- ●There is significant amount of wind gust, reaching speeds of up to 30 m/s.
Wind Speed & Direction - August
Wind Direction Distribution - August
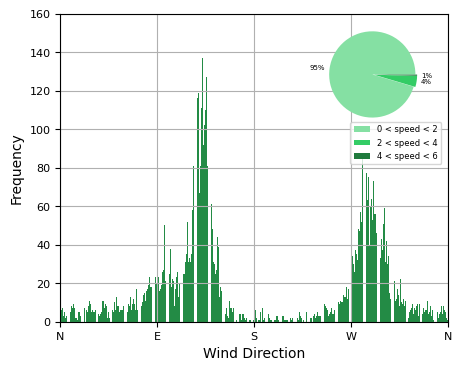
- ●Very calm month with respect to wind potential - 95% of wind speeds are below 2 m/s.
- ●Wind direction strongly correlates with general yearly trend.
- ●Overall poor wind gust being slightly height then wind speed itself.
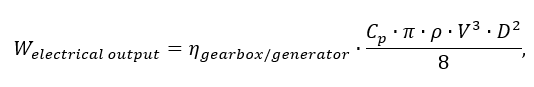
Power Generated by a Wind Turbine Estimation
To estimate the amount of energy, that could have been generated by a wind turbine based on measured data, the following equation will be used:
where ηgearbox/generator - combined efficiency of the gearbox and generator (85%);
Cp - desired power coefficient (40%);
ρ - air dencity, kg/m3;
V -wind speed, m/s;
D - diameter of the wind turbine disk, m;
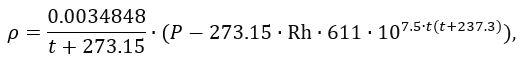
The air density, which is the only missing value in the equation, can be expressed by the following formula:
where t - temperature, °C; P - pressure, Pa; Rh - relative humidity, %.
Based on recent technological advancements in wind energy, and considering the installation capacity required for a given household,
we consider a wind turbine height of 9 meters and a rotor diameter of 5.6 meters.
The following graphs show the monthly wind power distribution calculated considering the wind direction aligned with
the turbine (115° < wind direction < 135°):
Wind Power Distribution
Positive Wind Direction Distribution
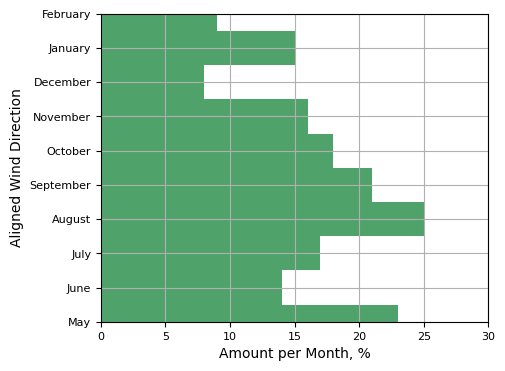
Key observations & insights:
- ●Wind Power depends not only on the wind speed but also on wind direction, meaning that relatively quite months have
still potential to generate acceptable amount of energy.
- ●As deduced above, January is the most stable month in terms of both wind speed and
direction, which therefore has high potential of energy production.
- ●Overall, given location can be considered as suitable to Wind Energy Generation.
Next Step
- ▶Install Weather stations at different height to understand wind dynamics.
- ▶Use Machine Learning and generative AI to identify best Wind Generator type, orientation, height and size.
- ▶Build Machine Learning model to accurately predict the weather, which will allow to optimize energy consumption.